File originale (824 × 346 pixel, dimensione del file: 15 KB, tipo MIME: image/png)

Logo di Commons
Logo di Commons
Questo file e la sua pagina di descrizione (discussione · modifica) si trovano su Wikimedia Commons (?)
Descrizione See below.
Data 8 dicembre 2007 (data di caricamento originaria)
Fonte Trasferito da en.wikipedia su Commons da jtneill.
 
Questo diagramma in PNG grafica è stato creato con Mathematica.
Autore Imagecreator di Wikipedia in inglese
Altre versioni File:CovrarianceCorrelation.svg, File:Correlation examples2.svg
File:Correlation examples2.svg è una versione vettoriale di questo file. Dovrebbe essere usata quella versione al posto di questo file PNG, quando sia migliore.

File:Correlation examples.png → File:Correlation examples2.svg
Per maggiori informazioni, vedi Help:SVG.

In altre lingue
Alemannisch  العربية  беларуская (тарашкевіца)  български  বাংলা  català  нохчийн  čeština  dansk  Deutsch  Ελληνικά  English  British English  Esperanto  español  eesti  euskara  فارسی  suomi  français  Frysk  galego  Alemannisch  עברית  hrvatski  magyar  հայերեն  Bahasa Indonesia  Ido  italiano  日本語  ქართული  한국어  lietuvių  македонски  മലയാളം  Bahasa Melayu  norsk bokmål  Plattdüütsch  Nederlands  norsk nynorsk  norsk  occitan  polski  prūsiskan  português  português do Brasil  română  русский  sicilianu  Scots  slovenčina  slovenščina  српски / srpski  svenska  தமிழ்  ไทย  Türkçe  татарча / tatarça  українська  vèneto  Tiếng Việt  中文  中文(中国大陆)  中文(简体)  中文(繁體)  中文(马来西亚)  中文(新加坡)  中文(臺灣)  中文(臺灣)  +/−
Nuova immagine SVG

[[:File:CovrarianceCorrelaخن tion.svg]] è una versione vettoriale di questo file.

Errore: Non esiste alcun file con questo nome. Per favore assicurati di aver usato la sintassi corretta: {{vector version available|nome del nuovo file.svg}}


File:Correlation examples.png → [[:File:CovrarianceCorrelaخن tion.svg]]

Per maggiori informazioni, vedi Help:SVG.

In altre lingue
Alemannisch  العربية  беларуская (тарашкевіца)  български  বাংলা  català  нохчийн  čeština  dansk  Deutsch  Ελληνικά  English  British English  Esperanto  español  eesti  euskara  فارسی  suomi  français  Frysk  galego  Alemannisch  עברית  hrvatski  magyar  հայերեն  Bahasa Indonesia  Ido  italiano  日本語  ქართული  한국어  lietuvių  македонски  മലയാളം  Bahasa Melayu  norsk bokmål  Plattdüütsch  Nederlands  norsk nynorsk  norsk  occitan  polski  prūsiskan  português  português do Brasil  română  русский  sicilianu  Scots  slovenčina  slovenščina  српски / srpski  svenska  தமிழ்  ไทย  Türkçe  татарча / tatarça  українська  vèneto  Tiếng Việt  中文  中文(中国大陆)  中文(简体)  中文(繁體)  中文(马来西亚)  中文(新加坡)  中文(臺灣)  中文(臺灣)  +/−
[[File:CovrarianceCorrelaخن tion.svg|Nuova immagine SVG|150x150px]]

Dettagli

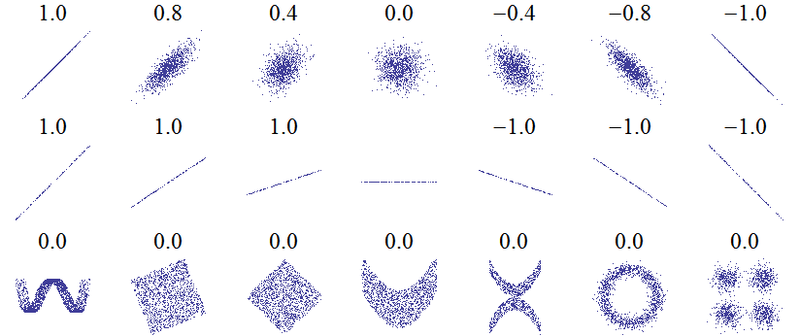
An example of the correlation of x and y for various distributions of (x,y) pairs. It was created by this Mathematica 6 code, which I wrote and release into the public domain (needs makePlot!):

n = 2000;
GraphicsArray[{
  Table[makePlot[
    Table[{RandomReal[NormalDistribution[0, 1]], (1 - Abs[w])*
        RandomReal[NormalDistribution[0, 1]]} . 
      RotationMatrix[-Sign[w]*Pi/4], {i, -1, 1, 2./n}], 1000], {w, 
    1, -1, -1/3}],
  Table[makePlot[Table[{x, slope*x}, {x, -1, 1, 2./n}], 100], {slope, 
    1, -1, -1/3}],
  {
   makePlot[
    Table[{x + RandomReal[]/3, 
      4 (x^2 - 1/2)^2 + RandomReal[]/500} , {x, -1, 1, 2./n}], 2000],
   makePlot[
    Table[{RandomReal[{-1, 1}], RandomReal[{-1, 1}]} . 
      RotationMatrix[-Pi/8], {x, -1, 1, 2./n}], 1400],
   makePlot[
    Table[{RandomReal[{-1, 1}], RandomReal[{-1, 1}]} . 
      RotationMatrix[-Pi/4], {x, -1, 1, 2./n}], 1400],
   makePlot[Table[{x, x^2 + RandomReal[]}/2, {x, -1, 1, 2./n}], 
    1400],
   makePlot[
    Table[{x, x^2 + RandomReal[]/2}*(RandomInteger[1]*2 - 1), {x, -1, 
      1, 2./n}], 1000],
   makePlot[
    Table[{Sin[x*Pi] + RandomReal[NormalDistribution[0, 1/8]], 
      Cos[x*Pi] + RandomReal[NormalDistribution[0, 1/8]]}, {x, -1, 1, 
      2./n}], 1400],
   makePlot[
    Table[{RandomReal[NormalDistribution[0, 1/3]], 
       RandomReal[
        NormalDistribution[0, 1/3]]} + {RandomInteger[1]*2 - 1, 
       RandomInteger[1]*2 - 1}, {x, -1, 1, 2./n}], 1400]
   }
  }]

Licenza

Public domain Quest'opera è stata rilasciata nel pubblico dominio dal suo autore, Imagecreator di Wikipedia in inglese. Questa norma si applica in tutto il mondo.
In alcuni paesi questo potrebbe non essere legalmente possibile. In tal caso:
Imagecreator garantisce a chiunque il diritto di utilizzare quest'opera per qualsiasi scopo, senza alcuna condizione, a meno che tali condizioni siano richieste dalla legge.

Registro originale del caricamento

La pagina di descrizione originale era qui. Tutti i nomi utente che seguono sono riferiti a en.wikipedia.
  • 2007-12-08 19:16 Imagecreator 824×346×8 (20371 bytes) == Summary == An example of the correlation of x and y for various distributions of (x,y) pairs. It was created by this Mathematica 6 code, which I wrote and release into the public domain: <pre> (*Several sets of (x,y) points, with the correlation coef
  • 2007-12-08 18:48 Imagecreator 824×346×8 (21374 bytes) An example of the correlation of x and y for various distributions of (x,y) pairs. It was created by this Mathematica 6 code, which I wrote and release into the public domain: (*Several sets of (x,y) points, with the correlation coefficient of x \ and y

Didascalie

Aggiungi una brevissima spiegazione di ciò che questo file rappresenta

Elementi ritratti in questo file

raffigura

image/png

bb8ddae02ac1df1c7577cdca1325347c11ecac3b

15 745 byte

346 pixel

824 pixel

Cronologia del file

Fare clic su un gruppo data/ora per vedere il file come si presentava nel momento indicato.

Data/OraMiniaturaDimensioniUtenteCommento
attuale10:33, 2 feb 2010Miniatura della versione delle 10:33, 2 feb 2010824 × 346 (15 KB)JBWRemoving "0.0" for correlation coefficient from horizontal line: here corr. coeff. is undefined.
11:27, 18 mar 2008Miniatura della versione delle 11:27, 18 mar 2008824 × 346 (20 KB)Jtneill{{Information |Description={{en|An example of the correlation of x and y for various distributions of (x,y) pairs. It was created by this Mathematica 6 code, which I wrote and release into the public domain: n = 2000; GraphicsArray[{ Table[makePlot[

La seguente pagina usa questo file:

Utilizzo globale del file

Anche i seguenti wiki usano questo file: